Introduction
There honestly was not much I thought about ranomd forest classifiers. I felt they were slightly more interesting than decision trees because I thought they were a little more robust, however at the end of the day it was just another classifier I got familiar with.
Code
Just standard code that was copy, pasted, and modified from my Kernel SVM project since they used the same data set. I also chose a number of trees I felt was good based off other models that I’ve seen (10).
from sklearn.preprocessing import StandardScaler
sc = StandardScaler()
X_train = sc.fit_transform(X_train)
X_test = sc.transform(X_test)

#Creating and fitting classifier of random forest classification
from sklearn.ensemble import RandomForestClassifier
classifier = RandomForestClassifier(n_estimators = 10, criterion = 'entropy', random_state = 0)
classifier.fit(X_train, y_train)
Results
After training, I plot the data using the following lines of code:
from matplotlib.colors import ListedColormap
X_set, y_set = X_test, y_test
X1, X2 = np.meshgrid(np.arange(start = X_set[:, 0].min() - 1, stop = X_set[:, 0].max() + 1, step = 0.01),
                     np.arange(start = X_set[:, 1].min() - 1, stop = X_set[:, 1].max() + 1, step = 0.01))
plt.contourf(X1, X2, classifier.predict(np.array([X1.ravel(), X2.ravel()]).T).reshape(X1.shape),
             alpha = 0.75, cmap = ListedColormap(('red', 'green')))
plt.xlim(X1.min(), X1.max())
plt.ylim(X2.min(), X2.max())
for i, j in enumerate(np.unique(y_set)):
    plt.scatter(X_set[y_set == j, 0], X_set[y_set == j, 1],
                c = ListedColormap(('red', 'green'))(i), label = j)
plt.title('Logistic Regression (Test set)')
plt.xlabel('Age')
plt.ylabel('Estimated Salary')
plt.legend()
plt.show()
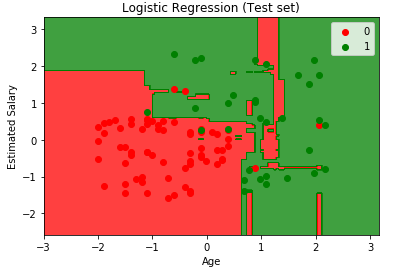
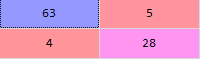
Looking at the results gave me a sense of duality. This model looked powerful in correctly organizing data, however it looked a little TOO powerful. The classifier looks incredibly susceptible to overfitting. A rather unfortunate consequence, however the degree of which this happens could be tuned by changing the number of trees. I wanted to see how adverse these effects could have, so I dropped the number of trees to 4.
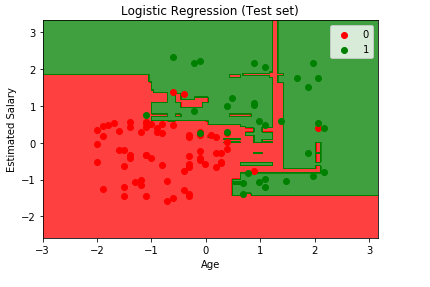
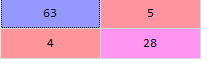
From a visual standpoint, the graph seems less tailored to the data, and looking at the confusion matrix it can be seen that there isn’t a drastic change in incorrect predictions. I felt this is definitely a good model to keep in mind.